—
September 2025
As I do more work on complex projects, I’m realizing that whenever I do some introspection I find more issues than I was looking for. Introspection gives me a better understanding of how my code is working, and with this better understanding I can spot errors and produce more robust software.
To clarify, by introspection I mean anything which allows me to see what my program is doing under the hood.
What prompted me to write this post is that the other day I was working on my system call tracer and was thinking “I should search functionality off into a separate thread, so it doesn’t block the GUI when searching through larger traces”. But before I started, I figured I should quantify how much data I was processing, and how much time it was currently taking.
To quantify this, I did two things:
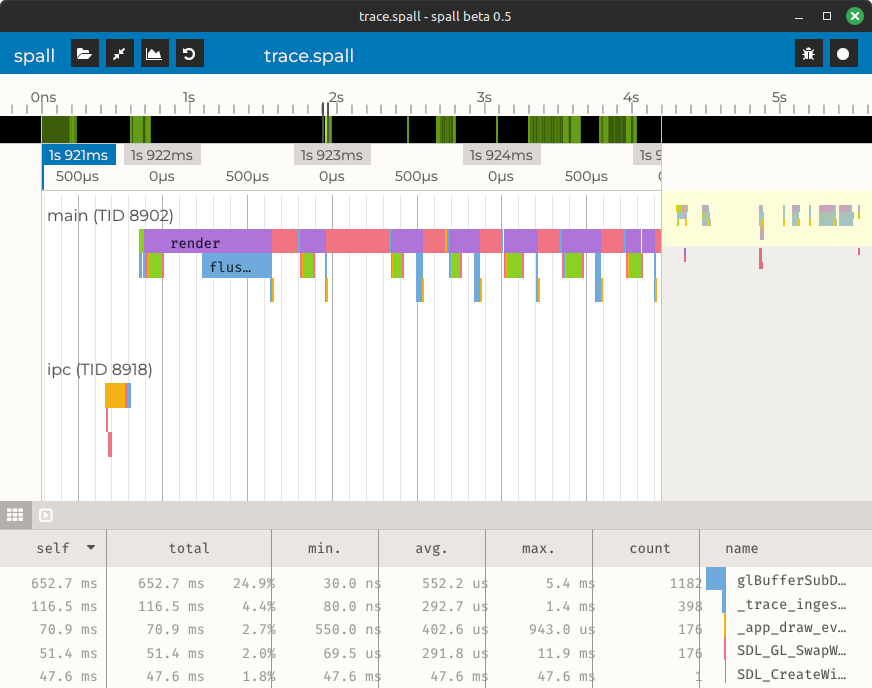
First, I integrated spall into my
program. Spall is a simple profile trace visualizer. In a sense this is
overkill for what I want to do, I could have just put a pair of
clock_gettime() calls around the the search function and
printed the result. But I enjoy looking at traces in spall more than I
like looking at numbers in a console, so I figured I’d spend an hour
integrating it with my codebase.
When I ran spall, I quickly noticed a an issue:
The main loop of my GUI is either idle (waiting for input), or running (if there was input, or an animation is playing). When it is running, it should run no faster than 1 / screen refresh rate. But for the first few frames after changing from idle to running, the loop was running as fast as the processor was able to run the per-frame logic. This turned out to be a common-ish issue with OpenGL, or rather with GPU graphics APIs in general, which happened to show up with my current HW+SW setup. I found a description of the issue and a solution on the HMN discord (as an aside, I think having programming forums on discord hurts discoverability).
It turned out to be a straight-forward fix. But if I hadn’t done the extra work of setting up spall, I wouldn’t have noticed the issue, and my program would have kept being subtly wrong.
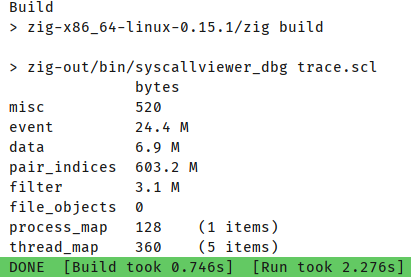
Second, I added some print statements which would show how much memory different parts of the trace were using (when the syscall viewer loads a trace, it generates multiple auxiliary data structures to index into the data).
My goal was to know how many kB/MB of data the search function would have to traverse.
What I instead noticed, was that one of the auxiliary data structures was orders of magnitude larger than expected. Turns out, I had a bug where I was incorrectly reallocating the array for the data structure. The bug was trivial to fix once I knew that it was there, but if I hadn’t added these print statements I likely wouldn’t have noticed for a long time.
These are just two examples of bugs I’ve found “accidentally” because I took the time to set up some kind of program introspection. I believe finding and fixing issues like this is necessary in order to produce robust software.
It makes me wonder what other tools for program introspection there are which I am not aware of…